3 Questions and Answers about Savings with Heat Map
What is a heat map?
Heat map is a smart tool for representing and comparing collected data such as consumption of water, electricity or gas. Values are pictured by a color spectrum to quickly compare big amount of data. No energy audit will surprise you!
How to use heat map in Enectiva application?
Heat map is a new means to present energy data. After logging in, select Statistics in the upper bar and underneath choose which type of energy we want to track. The heat map is one of the means of displaying data and a new type of graph: in the white bar open dropdown menu and choose Heat map. On the right select building or measurement source as well as time frame.
SCADA systems integrated with cloud services
Since the New Year you have been able to use energy management, facility management, but also complex building management systems in one online solution. Enectiva involve the worlds of IoT (Internet of Things), Building Management System (BMS) and cloud services for building management right now. A part of the BMS is also SCADA, which provides supervision, control and data aquisition.
What you can manage with the Enectiva online app:
- Heating, Ventilation, Cooling, Air Conditioning (HVAC), DWH (Domestic Hot Water)
- Outdoor and indoor lighting
- Manufacturing technologies
- Pumps or other drives
- Security systems
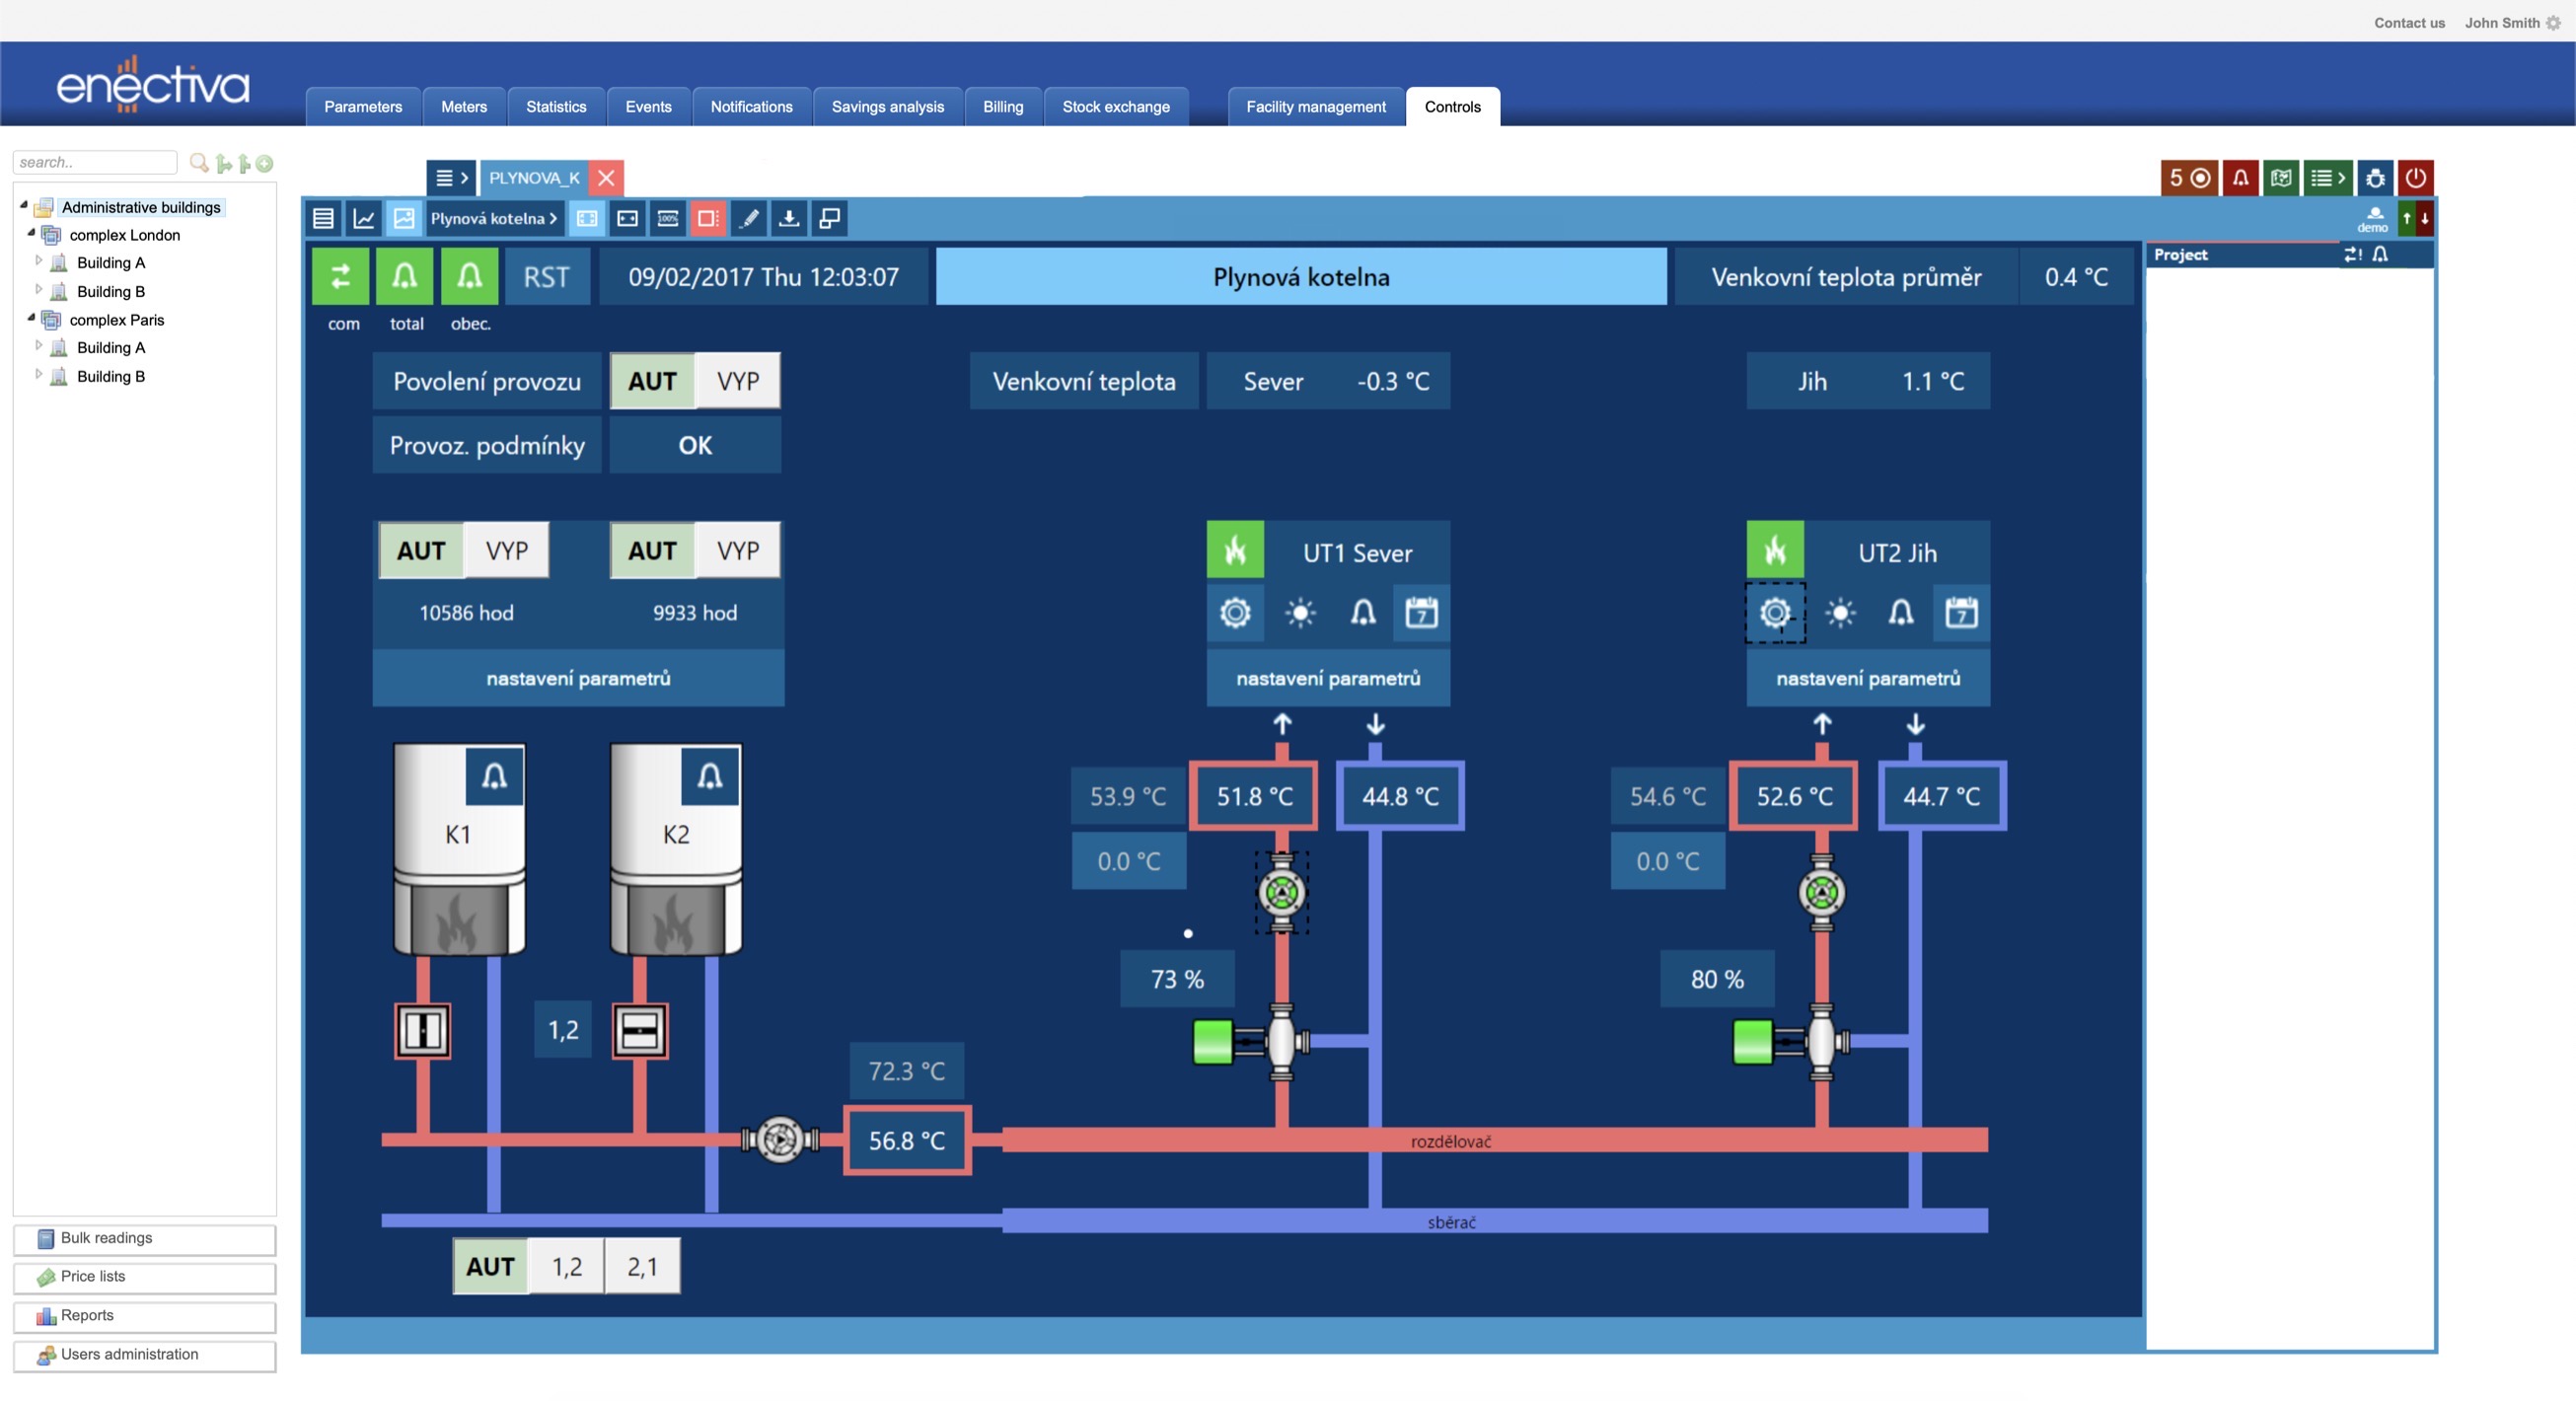
How to connect the SCADA system to Enectiva?
Everything is based on the integration of individual PLC or controllers. Any BMS or SCADA must necessarily include such a controller. Larger systems consist of multiple controllers, and one of them is usually considered as a master. SCADA is running then on such a controller. Within the Enectiva application, these controllers can be paired to individual entities in the tree under the newly created tab in the upper menu Control. Each building, part of the building, tenant, economic unit or business unit can have from 1 to n controllers associated with each other. When you are on the Control tab and the entity has at least one controller assigned, the complete SCADA in the application is connected and displayed.
Binary data series – monitoring of two states (on x off, open x closed…)
We have improved the user interface of binary data series for better clarity and efficiency. Binary data series are usually used to monitor two opposed states, such as open/closed, on/off etc. The typical example of binary data series usage is the monitoring of how long your gate is open or how long are the lights on in your factory.
What can you monitor with binary data series: How long is a gate open
- How long the lights are on
- How long is a certain switch in a certain position (such as switch on lighting, AC, ventilation…)
- The presence of people (some in present x someone is absent)
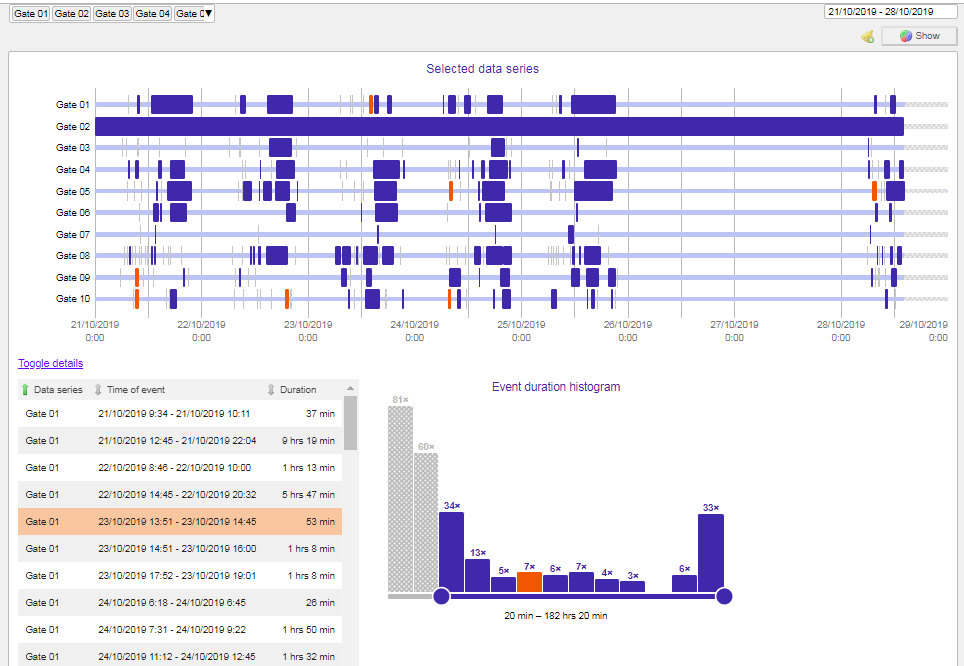
The main motivation is always to save money. In case of monitoring doors and gates, the typical energy management know-how says that you can save up to 6 % of your heating expenses if you decrease the room temperature by 1 °C. Why should you lose heat just because your gate is open? Thus, in case of monitoring how long your gate open or closed, you need to monitor the temperature as well. We recommend to add an automatic notification that will remind you if a certain gate is open too long. You can combine binary data series with a people counter as well.
Influence of average daily temperature on water consumption
We are a Czech technology startup and our field is energy data collection and analysis. We bring you another of our reports, which aims to inform the public about interesting findings that provide us with data on energy consumption. This time it is water. Specifically, the influence of external temperature on its consumption.
The current hot summer days and the ever-increasing drought that prevailed in our country prompted us to investigate this phenomenon. In countries where most water is consumed in agriculture, the dependence between average daily temperature and water consumption will be significant from the logic of the matter, but how is it in the Czech Republic? In a country where only up to 10% of all water is consumed in agriculture and industry and energy account for the largest share?
Energy management in retail
Another part, in which we discuss the specifics of energy management, concerns the retail and retail chains. If you are in charge of energy management and play the role of energy manager for the retail (retail chain), you usually have a significant advantage over other energy managers. You manage a portfolio of branches, which is usually very easy to compare. Individual branches / shops are often the same in terms of size, number of employees and installed technologies. This feature as an energy manager you can use it to compare consumption per branch per m2, per square meter of sales area, per employee, or to compare branches and their consumption during opening hours and when the shop is closed. In the case of a large portfolio, benchmarking is always important and allows you to focus quickly on the most problematic branches, which also offer the greatest potential. We know from experience that also monitoring consumption outside opening hours is an absolute necessity that can detect considerable waste.